Reports
The Reports page gathers financial reports in tabs, one report per tab. Open it from Reports in the Analysis group of the sidebar, or from the More menu on a phone. It has four tabs: Independence, Cash flow, Builder and Retirement. It is not the scheduled email reports feature: those send you a summary of your net worth by email, and are described in Scheduled email reports.
Financial independence
Section titled “Financial independence”The Independence tab answers one question: from which date could your investments cover your spending? The date is the day your investable accounts are worth enough that withdrawing a set share of them each year, the withdrawal rate, would pay for a year of spending.
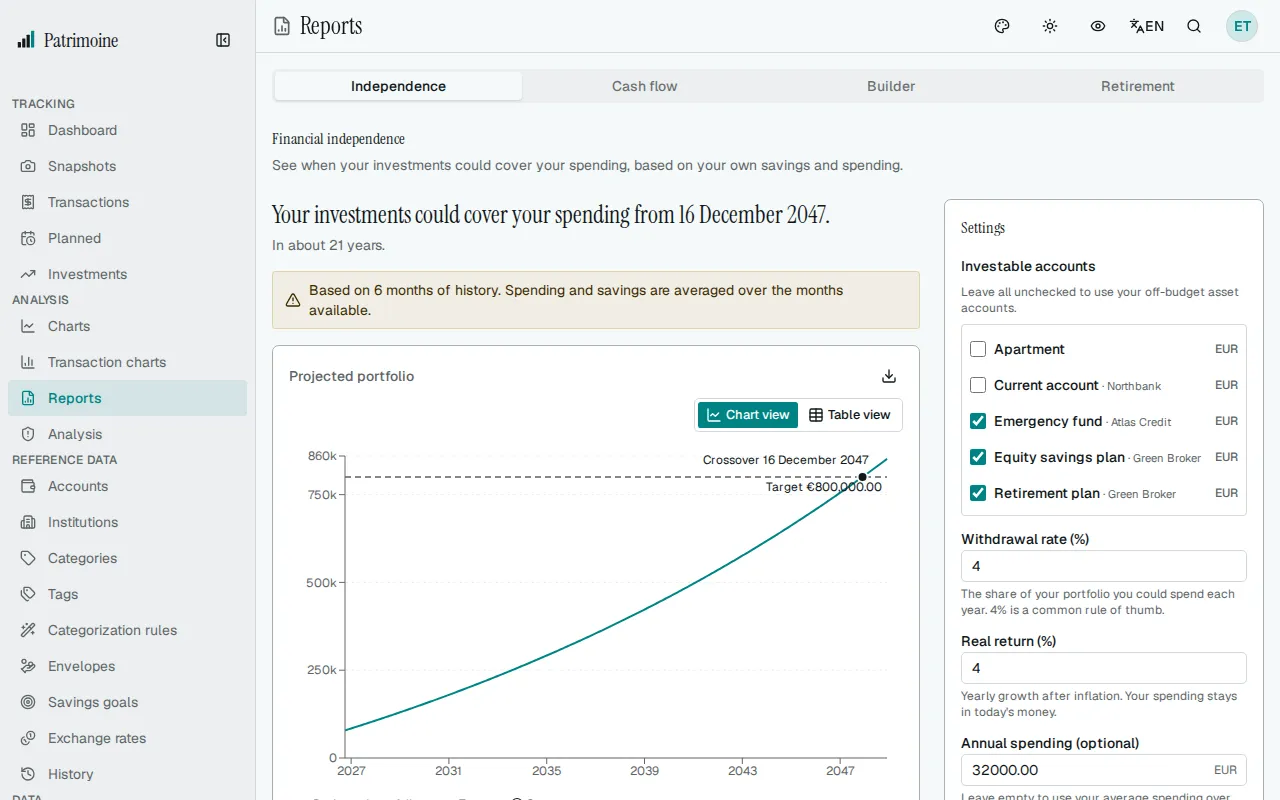
The headline gives that date, for example “Your investments could cover your spending from 12 April 2031.”, and the line under it rounds the time left to the nearest year: “In about 4 years.”, or “In less than a year.” when the date is less than six months away.
The date comes from your own transactions and snapshots, not from a figure you type in: Patrimoine projects your investable accounts month by month from their latest balance, your average savings and a yearly growth rate.
Other outcomes
Section titled “Other outcomes”- If your investable accounts already cover a year of spending, the headline reads “Your investments already cover your spending.” and compares your portfolio with the target it needs.
- If the target is not reached within 50 years, the headline reads “Not reached within 50 years.” Saving more or spending less brings the date closer.
- If there is no completed month of transactions yet, the tab says there is not enough history and links to your transactions and to a new snapshot.
- If your yearly spending is zero (no expenses recorded and no yearly spending typed in the settings), the tab says there is no spending to project from and offers a button that takes you to the yearly spending setting. Without spending the target would be zero, which any balance reaches, so no date is given.
- If no account counts as an investment, the tab says so and shows no chart. By default your off-budget asset accounts that are not excluded from net worth count as your investments.
Chart and table
Section titled “Chart and table”The chart plots the projected portfolio as a line against a dashed line at the target, and marks the crossover with its date. The Chart view and Table view buttons switch between the chart and a table of today, each January and the crossover date, with the projected portfolio and the target. The export button downloads that table as a CSV file with the real figures, even when privacy mode hides amounts on screen.
Assumptions
Section titled “Assumptions”Under the chart, a list shows exactly what the projection used:
- Annual spending: your average monthly spending over the completed months, among the last 12, that have transactions, times 12. The current month is left out because it is not over. Expenses in categories you flagged “exclude from spending” are left out too, and the amount is shown under the figure.
- Monthly savings: your average monthly savings over the same months.
- Starting balance: the latest balance of your investable accounts.
- Target portfolio: the annual spending divided by the withdrawal rate.
- Withdrawal rate: 4% by default.
- Real return: 4% a year by default, after inflation, so every figure stays in today’s money.
- Accounts: your off-budget asset accounts that are not excluded from net worth, by default.
Changing the assumptions
Section titled “Changing the assumptions”A Settings card sits beside the result on a wide screen and below it on a phone. It holds the choices behind the projection:
- Investable accounts: tick the accounts that count as your investments. The list shows your active accounts that are not liabilities, with their currency; each account is named “Account · Institution”, with the institution after the name, so accounts with the same name at different institutions can be told apart. With none ticked, your off-budget asset accounts that are not excluded from net worth are used and the card says so. An account you tick counts even if it is excluded from net worth. Unticking every account and saving returns to that default.
- Withdrawal rate: between 0.5% and 10%.
- Real return: between -2% and 12% a year, after inflation.
- Annual spending: optional. Enter a yearly amount in your base currency to replace the average taken from your transactions, or leave it empty to keep the average. The assumptions list then shows the amount as set by you.
Reset to defaults puts 4%, 4%, no annual spending and no ticked accounts back in the form. It saves nothing: nothing changes until you select Save and recalculate. That button saves only the fields you changed, recalculates the date and moves focus to the headline. A value outside its range is flagged next to its field and nothing is saved until it is corrected.
The settings are stored with your account, so they follow you across devices, and they are part of your backups.
Notices
Section titled “Notices”- With fewer than 12 months of history, a notice tells you how many months the result is based on. Spending and savings are then averaged over the months available.
- If your savings were zero or negative over that period, a notice says the projection grows by investment return only. It does not mean the target cannot be reached.
- If an exchange rate is missing, the amounts that need it are left out, and a notice names the currencies and warns that totals may be incomplete.
Cash flow
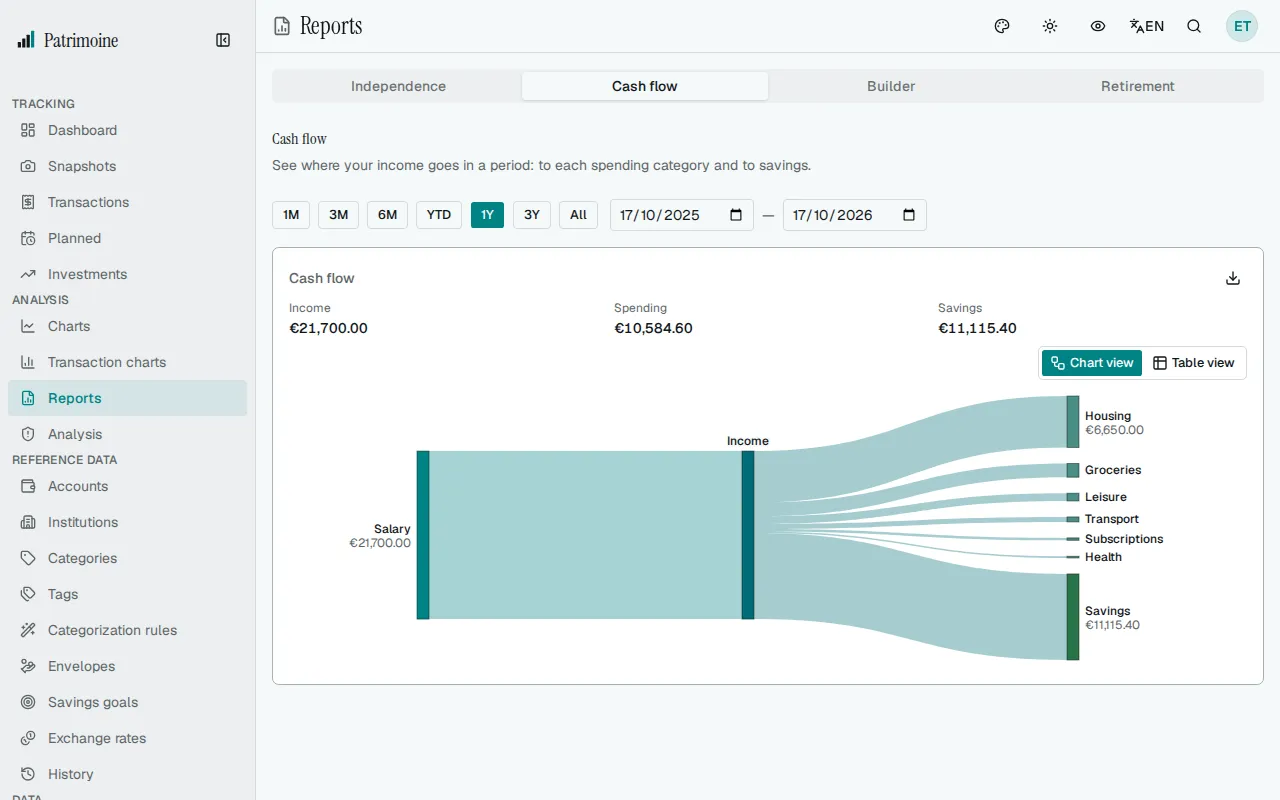
Section titled “Cash flow”The Cash flow tab shows where the income of a period went. A diagram follows the money from left to right: your income sources feed an Income block in the middle, and from there the money flows out to each spending category and to Savings. The wider a band, the larger the amount.
Choosing the period
Section titled “Choosing the period”The period buttons above the diagram set the period. It starts on the last 12 months; All covers every transaction up to today, and you can also enter exact start and end dates. The diagram, the summary and the table update when you change the period, and screen readers are told “Cash flow updated.”
Reading the diagram
Section titled “Reading the diagram”- Sources on the left: your 5 largest income categories. When there are more, the rest are grouped in a block called Other, which only appears if it groups at least two categories. Pointing at it tells you how many it holds.
- Destinations on the right: your 8 largest spending categories, with the rest grouped as Other in the same way.
- Savings: when you earned more than you spent, the difference appears as a solid Savings block on the right.
- Deficit: when you spent more than you earned, a hatched Deficit block appears on the left as an extra source of funds, so both sides always balance. The summary above the diagram then shows the deficit with a minus sign, and a short note explains it.
- Pointing at a band shows where it goes, its amount and its share of the total, for example “Income to Groceries: €500.00 (16.7% of the total)”. Pointing at a block shows its name and amount.
- Category names longer than 22 characters are shortened in the diagram; the full name appears when you point at it. Transactions without a category are shown as Uncategorized.
The summary above the diagram gives the income, the spending and the savings (or deficit) of the categories shown, so it always matches the diagram.
What is counted
Section titled “What is counted”- Each category is totalled over the period. A category whose total is zero or below is left out, for example a spending category where refunds cancel the purchases.
- Transfers between your accounts and accounts that are off budget are not counted.
- A split transaction counts in the category of each of its lines.
- Amounts in other currencies are converted to your base currency with the exchange rate of each date. If a rate is missing, the amounts that need it are left out, and a notice names the currencies and warns that totals may be incomplete.
Table and CSV
Section titled “Table and CSV”The Chart view and Table view buttons switch between the diagram and a table of the same flows. The table has the columns From, To, Amount and Share of total, in two groups: first the income sources into Income, then Income out to the spending categories and Savings. Each group is sorted by amount, with Other last, and a deficit reads “Deficit to Income”. The export button downloads the same rows as a CSV file with the real figures. Privacy mode hides amounts in the diagram, the summary, the tooltips and the table; names and shares stay visible. The CSV file keeps the real figures.
On a phone
Section titled “On a phone”The diagram is wider than a phone screen, so it scrolls sideways: swipe it, or focus it and use the arrow keys. The Table view button is a quicker way to read every flow on a small screen.
Report builder
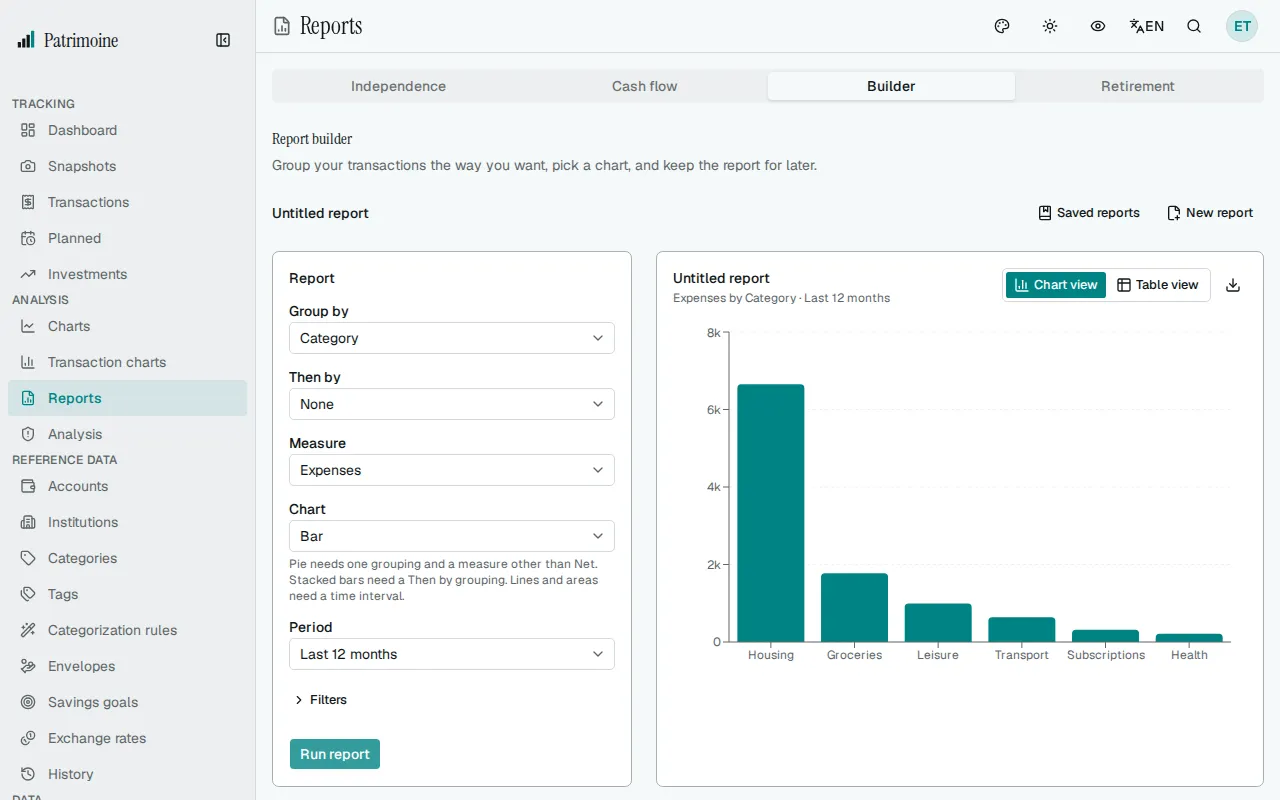
Section titled “Report builder”The Builder tab lets you build a report of your own from your transactions: choose how to group them, what to measure, how to draw it, and which period and filters to use, then select Run report. Running a report stores nothing. To keep a report, save it (see Saved reports below).
Defining a report
Section titled “Defining a report”- Group by: Category, Account or Time interval. An account is named “Account · Institution” in the chart, the table and the CSV.
- Then by: None, or a second grouping. It cannot be the same as Group by, so that option is disabled. If you change Group by to match Then by, Then by goes back to None and the form says so.
- Interval: appears when a grouping is a Time interval. Choose Day, Week, Month, Quarter or Year; the default is Month.
- Measure: Expenses, Income, Net or Number of transactions. Expenses are shown as positive amounts. Net is income minus expenses and keeps its sign, so a period in which you spent more than you earned is negative. Number of transactions counts a transaction split over several categories once in each of them, so with a category in the grouping the counts can add up to more than the number of transactions.
- Chart: see Chart types below.
- Period: see Period below.
- Filters: see Filters below.
When a grouping is a time interval, it is the horizontal axis and the other grouping gives the series, one colour each. Otherwise Group by is the horizontal axis and Then by gives the series.
Chart types
Section titled “Chart types”- Bar: one bar per group, or grouped bars when there is a Then by.
- Stacked bar: needs a Then by. The series are stacked on top of each other.
- Line and Area: need a time interval. Each series is a line, with a different dash pattern as well as a different colour.
- Pie: needs one grouping and a measure other than Net. The slices run clockwise from the top, largest first, and a list beside the pie gives each amount and share.
- Table: shows the figures only (see Table and CSV below).
The rules are written under the Chart field. A chart that the current settings cannot draw is disabled, with the note “Not available with these settings.” If an edit makes the chart you picked unavailable, the report goes back to Bar and a message tells you.
Period
Section titled “Period”The period starts on Last 12 months. You can also choose Last 3 months, Last 6 months, Year to date, Last year or All time. Custom range reveals From and To dates. Both are required and the start cannot be after the end; otherwise a message appears next to the dates and the report is not run.
Filters
Section titled “Filters”The Filters section is collapsed until you open it, and a badge shows how many filter groups are set. You can limit a report to some Accounts, to some Categories (a category, a subcategory, or Uncategorized) and to some Tags. An empty filter means no limit.
What is counted
Section titled “What is counted”- The same transactions as the Cash flow tab: transfers between your accounts and accounts that are off budget are not counted, and a split transaction counts in the category of each of its lines.
- Transactions without a category are grouped as Uncategorized.
- Amounts in other currencies are converted to your base currency with the exchange rate of each date. If a rate is missing, the amounts that need it are left out, and a notice names the currencies and warns that totals may be incomplete.
Limits and Other
Section titled “Limits and Other”- A chart shows at most 8 series. When a category or an account is on the horizontal axis, at most 50 groups are listed. The largest groups, by the size of their total, are kept and the rest is added up in a group called Other. A notice such as “Showing the top 7 of 12. The rest is grouped as Other.” says when this happened. A time interval axis always lists every interval.
- A report can hold at most 367 intervals. If the period has more, the report is not run and a message asks you to choose a larger interval or a shorter period.
- When nothing matches, the result says “Nothing matches this report” and suggests a longer period or fewer filters.
Reading the result
Section titled “Reading the result”The result card shows the name of the open saved report, or “Untitled report”, with a line that sums up the report, for example “Expenses by Category · Last 12 months”. After you run a report, focus moves to the result and screen readers are told “Report updated.”; on a phone the page scrolls to it. If the run fails, focus moves to the error message. Screen readers also get a description of the chart that includes its largest group.
If you change the form after a run, the previous result stays on screen with the note “Settings changed. Run the report to update the results.” until you run the report again.
Table and CSV
Section titled “Table and CSV”The Chart view and Table view buttons switch between the chart and a table of the same figures, with one column for each grouping followed by the measure. A Net amount shows a plus or minus sign. The table lists 50 rows per page by default; the page-size selector next to Previous and Next switches to 100 or 250. The export button downloads every row as a CSV file with the real figures. Privacy mode hides money amounts in the chart axis, tooltips, legend and table; names and numbers of transactions stay visible. The CSV file keeps the real figures.
Saved reports
Section titled “Saved reports”A saved report is a report definition you keep under a name, so you can reopen it in one click. It stores the settings, not the results: opening it runs it again on your current transactions.
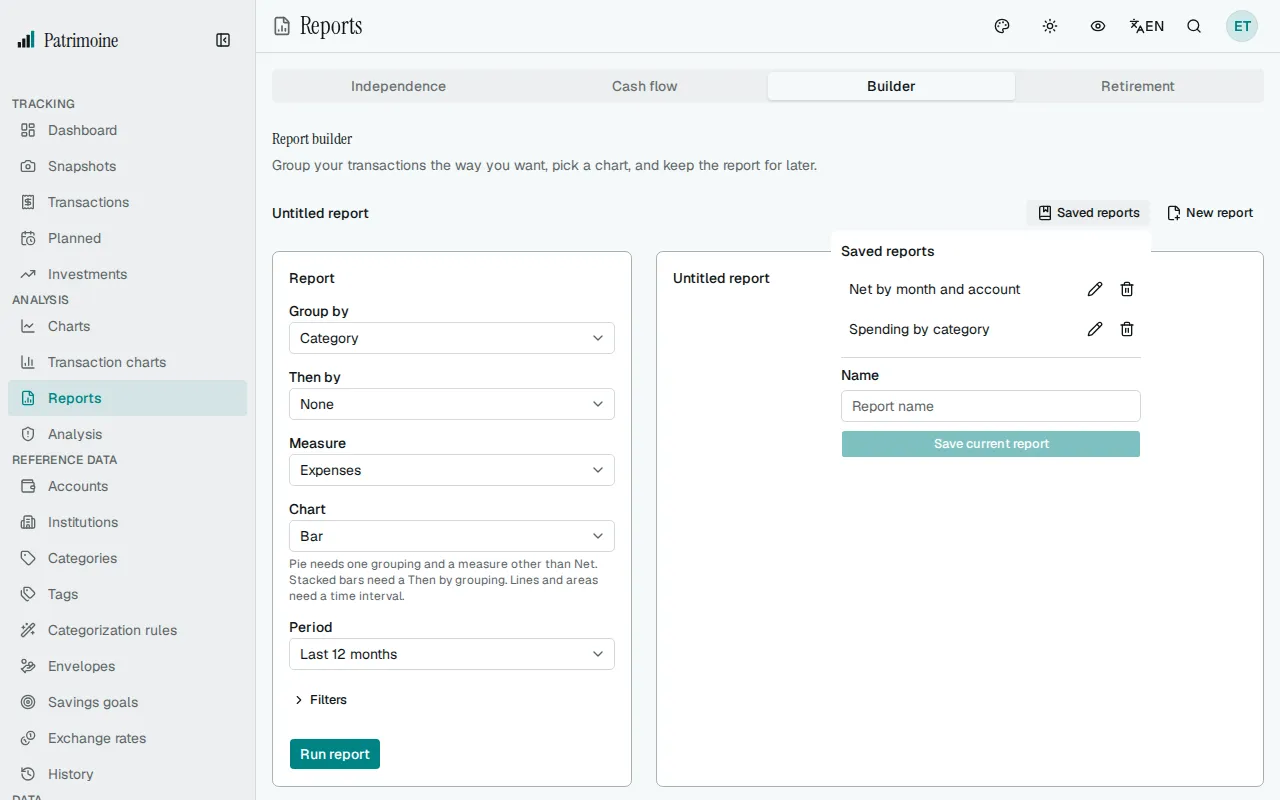
- Save: open Saved reports above the form, type a name (up to 120 characters) and select Save current report. The report is saved as it is in the form, whether or not you have run it. Names are unique, and you can keep up to 100 saved reports; the form tells you when a name is already taken or the limit is reached.
- Open: choose a name in the list. The report is loaded into the form, the list closes, the report runs at once and focus moves to the result.
- Name and changes: the row above the form shows the name of the open report, or “Untitled report”. It adds a Modified badge when the form differs from the saved report. Update report, which appears only then, replaces the saved settings with the form. New report starts again from the default settings and keeps the last result on screen.
- Rename: select the pencil next to a report, type the new name, and press Enter to save or Escape to cancel.
- Delete: select the bin next to a report, then confirm with Delete, or choose Keep. A report you delete is gone for good, but the report on screen stays: it simply becomes “Untitled report”.
- Filters that no longer exist: if a saved report is limited to an account, a category or a tag that you have deleted since, it still runs, without that filter, and a notice says how many filters of the saved report were ignored. The report can then cover more than when you saved it (every category instead of one, for example). Check the figures before relying on them.
Saved reports are part of your backups; see Import and export.
Retirement simulation
Section titled “Retirement simulation”The Retirement tab tests how well your investments hold up through retirement. Instead of a single forecast, it replays your situation across 5,000 randomly generated market paths and shows the range of outcomes. It never runs by itself: set the inputs, then select Run simulation.
How it works
Section titled “How it works”Every path starts today with the balance of your investable accounts. Until your retirement age it adds your average savings; from then on it takes your yearly spending out of the balance for the length of your retirement. Each year the market return is drawn at random: on average it is the real return of the Independence tab, and the market volatility sets how far a year can swing around that average. A path whose balance reaches zero stays at zero. All figures are in today’s money.
The accounts, starting balance, savings, spending and real return are the ones of the Independence tab, so what you set there applies here too. After a run, a line above the form says what was used, for example “Using 2 accounts worth €400,000.00, spending of €40,000.00 a year and a real return of 4%.” Change in Financial independence opens the Independence tab and puts focus on its settings. When a run finishes, focus moves to the headline with the success rate.
The inputs
Section titled “The inputs”- Current age: required, from 18 to 100. The simulation starts from this age, so it can count the years of saving before you retire.
- Retirement age: from 18 to 100, and after your current age.
- Retirement length: from 5 to 60 years.
- Market volatility: from 0% to 40% a year. About 15% is typical for a portfolio that is mostly stocks.
- Seed: a whole number from 0 to 2,147,483,647. The same seed and the same settings always give the same result, so you can come back to a result later or compare two sets of settings fairly. New seed fills in a random number without running anything.
The number of simulated paths is fixed and cannot be changed.
Run simulation saves these five values with your account, then runs the simulation from the saved values. They follow you across devices and are part of your backups. A value outside its range is flagged next to its field and nothing is saved or run until it is corrected. If the server refuses a value, for example a retirement age that is not after your current age, the message appears next to that field. If you change an input after a run, the result stays on screen with the note “Inputs changed since this run.” until you run the simulation again.
Reading the result
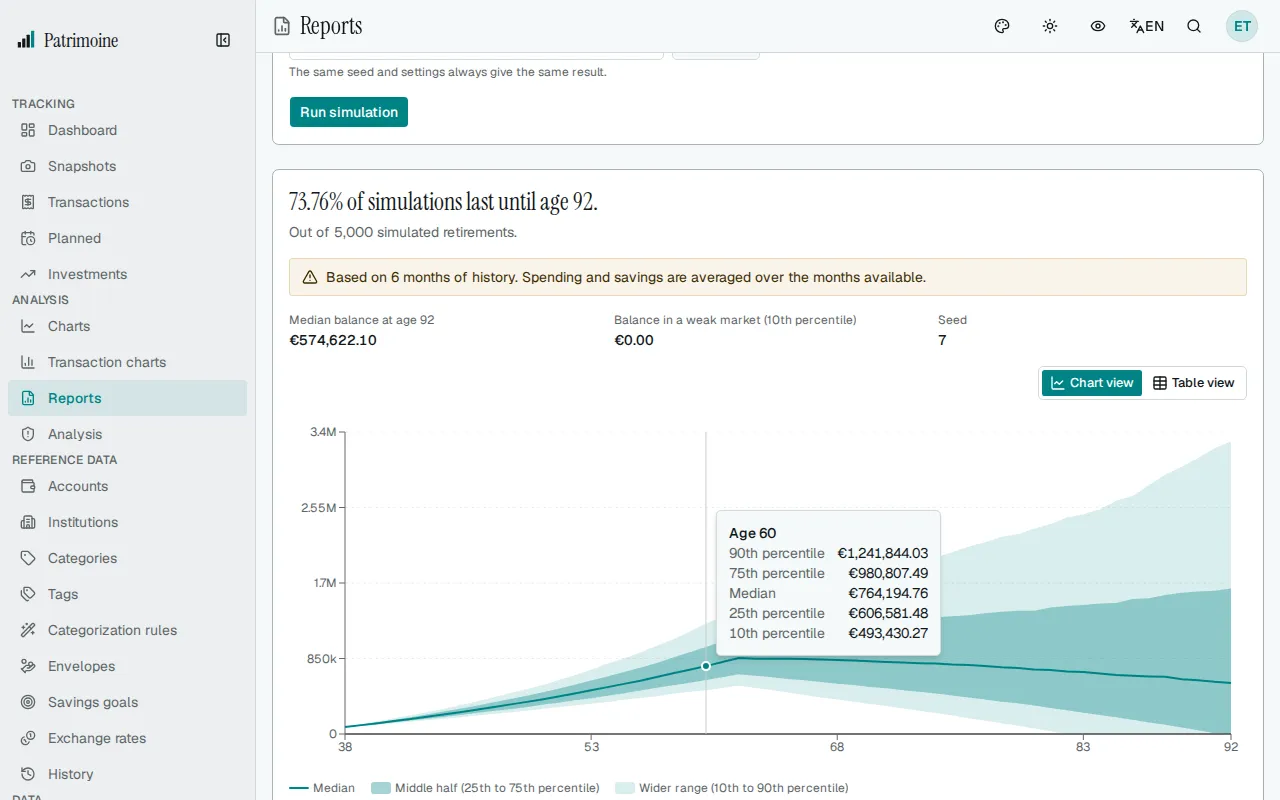
Section titled “Reading the result”- The headline gives the share of simulated paths that still have money at the end of your retirement, for example “87.5% of simulations last until age 95.” The line under it gives the number of paths. This is a measure of how often the money lasts, not a verdict: nothing is rated good or risky.
- Under it, the median balance at the last age (half of the paths end above it, half below), the balance in a weak market (the 10th percentile: one path in ten ends below it) and the seed.
- If other simulations are already running on the server, Run simulation says so; wait a few seconds and run it again. Your saved values are kept.
- The chart shows the median balance by age as a line. The darker band around it holds the middle half of the paths (25th to 75th percentile) and the lighter band the wider range (10th to 90th percentile). When the weak market runs out of money, a line marks zero. Pointing at the chart shows the figures for that age.
- The Chart view and Table view buttons switch between the chart and a table with a row for each year of retirement and the columns Age, 10th percentile, 25th percentile, Median, 75th percentile and 90th percentile. A retirement of 60 years has 60 rows, so the table is not paged.
- A note under the chart reminds you that this is a simulation, not a forecast: it assumes the settings above and cannot predict real markets.
Notices and empty states
Section titled “Notices and empty states”The simulation shares the starting point of the Independence tab, so it shows the same notices: how many months of history the result is based on when there are fewer than 12, a warning when your savings were zero or negative, and a warning naming the currencies when an exchange rate is missing and some amounts were left out. With no completed month of transactions, or with no account that counts as an investment, it shows the same two messages as the Independence tab and no result. The same goes for a yearly spending of zero: it shows the no spending message and no result.
Privacy mode hides balances in the figures under the headline, the axis, the tooltips, the table and the line above the form. The success rate, the ages, the seed and the number of simulations stay visible.