Investments
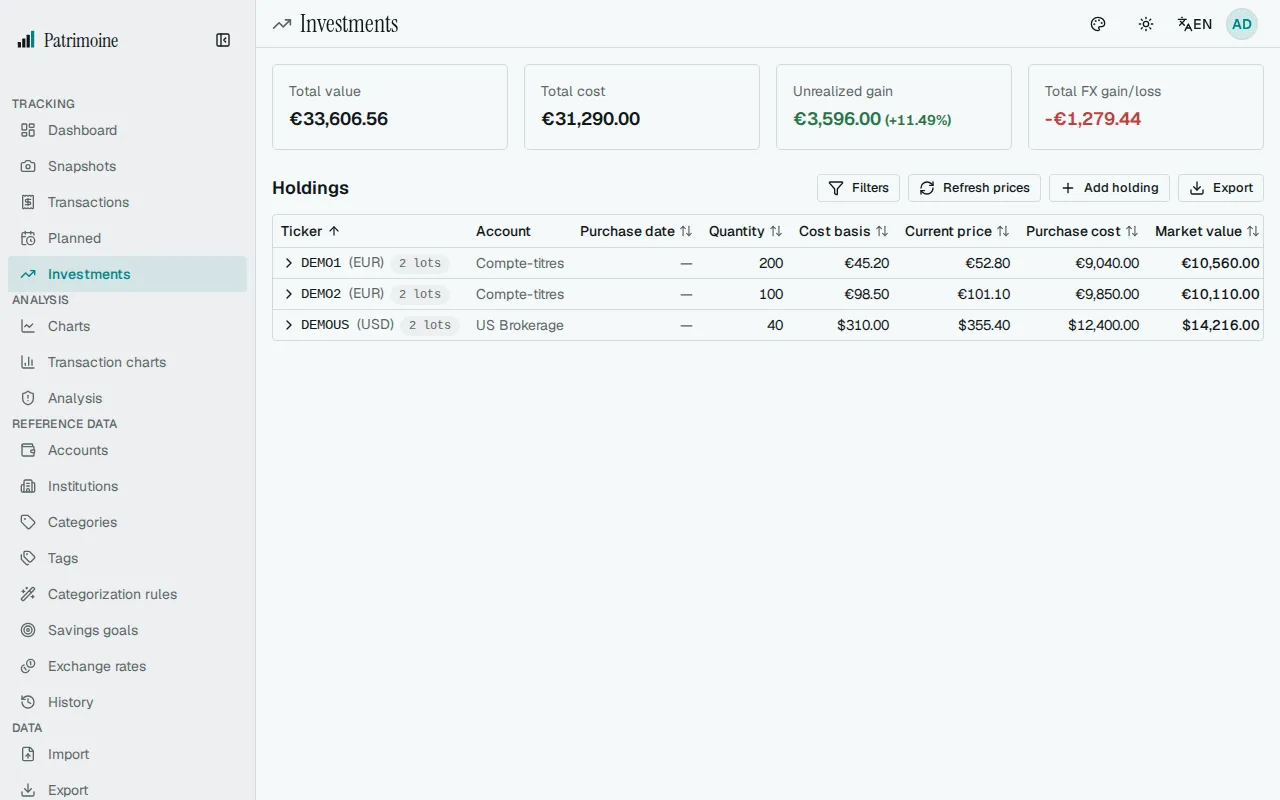
The Investments page tracks stock, ETF, and other ticker-based holdings, grouped by account, separately from your plain balance accounts.
Managing holdings
Section titled “Managing holdings”Add, edit, and delete holdings. Add holding is the main button at the top of the page (a + icon on a phone). Each holding records:
- A ticker and an account.
- An optional display name.
- A quantity, a cost basis, and a purchase date. A quantity holds up to 8 decimals and a price (the cost basis, and the current price) up to 8, so a fractional share or a small crypto amount keeps its digits. A price shows at least the currency’s own decimals and more only when it has them (12,50 €, 0,00000009 $); an extra digit past the 8th is rounded.
- An optional fee paid for the purchase, in the holding’s currency. Leave it empty for no fee.
- An optional currency.
- An optional asset class (stock, ETF, bond, crypto, cash, real estate, commodity or other). It feeds the Allocation by class tab, and a purchase without one is counted as Unclassified. Editing a purchase changes the class of that purchase only. When you add a purchase of a ticker you already hold, the form starts with the class that ticker’s purchases share (if its classified purchases do not all agree, it starts as Unclassified), and you can change it. The Android app does not show or set the class yet: a purchase added there is unclassified, and editing one there keeps its class.
- Optional free-text notes.
Holdings with the same ticker are grouped together across accounts and can be expanded to see individual purchase lots.
Fees and total cost
Section titled “Fees and total cost”A holding’s total cost is its cost basis times its quantity, plus its fee. The Total cost column shows this figure as worked out by the server, and a purchase with a fee shows the fee under it.
- Gains, the unrealized gain percentage, and the portfolio summary’s total cost include fees.
- The cost basis per unit, including a ticker’s average cost basis, leaves the fee out.
- A fee in another currency is converted at the purchase-date rate, like the cost, so it never changes the foreign-exchange gain.
- A fee cannot be negative.
In the Android app, each purchase shows a Total Cost line under its row: the total cost the server computes, followed by “incl. X fee” when the purchase had a fee. A group row (by ticker or by account) shows its total cost without the fee caption. The up or down marker next to a purchase’s value compares that value with this total cost, fee included. The fee itself is entered on the web or from the command line (or arrives with an import or a backup): the Android app has no fee field, and editing a purchase there keeps the fee it already has.
Symbol lookup and auto-fill
Section titled “Symbol lookup and auto-fill”Type a ticker in the Symbol field to search Yahoo Finance and pick a match. This auto-fills the name, currency, and current price from the quote, and suggests a cost basis from the nearest trading-day closing price for the purchase date you enter.
Filtering and sorting
Section titled “Filtering and sorting”Use the filters panel to narrow the holdings list by:
- Currency.
- Purchase-date range.
- Converted value range.
Combine it with a search box that matches ticker, name, and notes. Both the grouped holdings table and each group’s expanded lots can be sorted by clicking a column header.
Manual vs. automatic pricing
Section titled “Manual vs. automatic pricing”A holding’s current price is either entered manually or kept up to date automatically:
- Non-manual holdings are refreshed once a day against Yahoo Finance. You can also trigger an on-demand refresh from the page.
- Manual-priced holdings are always skipped by both the daily job and the on-demand refresh, so your entered price is never overwritten.
Dividends
Section titled “Dividends”Open a holding’s actions menu and choose Dividends to record the dividends it paid. For a ticker held in several purchase lots, expand the group and open the menu of the lot that received the dividend.
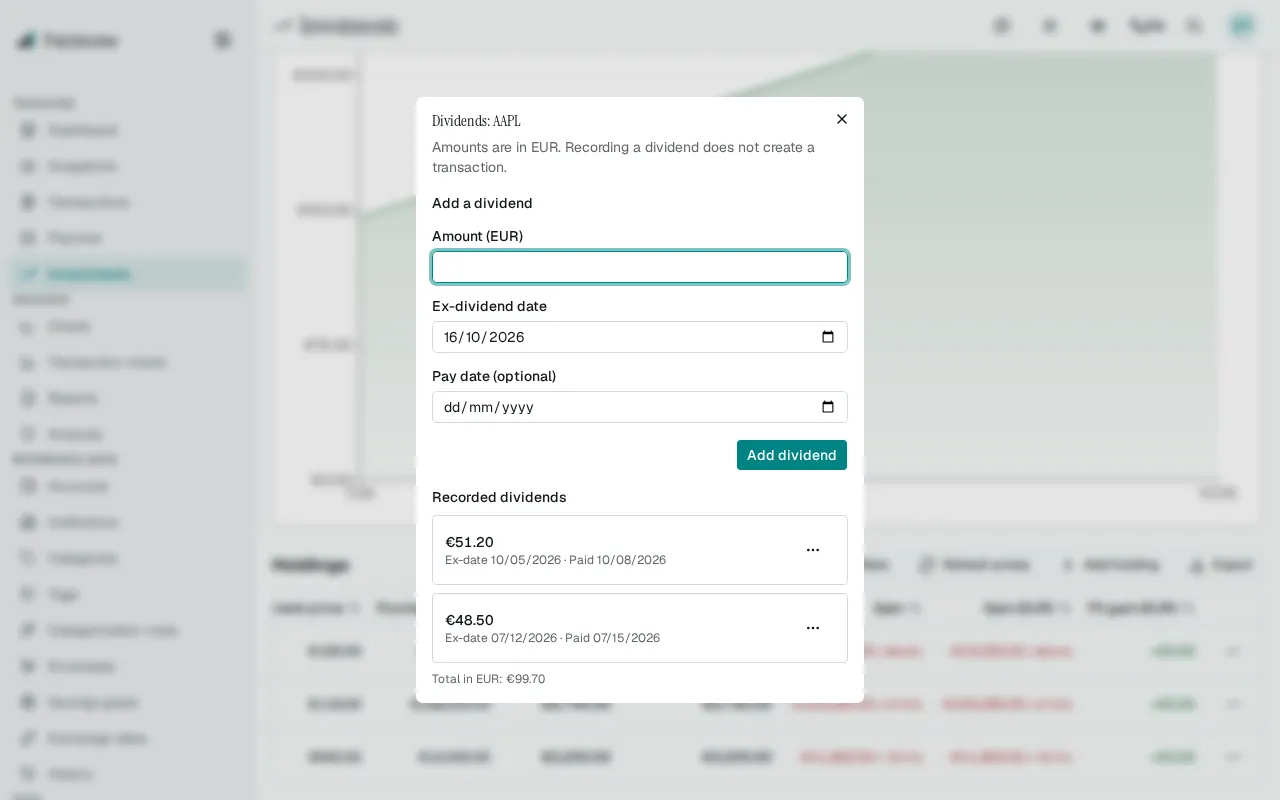
The dialog lists that holding’s recorded dividends, newest first. To add one, enter an amount, an ex-dividend date and, if you know it, a pay date. The amount is in the holding’s own currency, or in your base currency when the holding has none. Recording a dividend does not create a transaction.
Each recorded dividend has an actions menu with Edit and Delete. Edit loads the dividend into the form so you can change its amount or dates: choose Save dividend to keep the change, or Cancel to leave the dividend as it was. Delete asks for confirmation, then removes the dividend from the totals and the charts. Neither action affects any transaction.
Totals and the two dividend charts update as soon as you add a dividend. They appear once at least one holding has dividend history: a dividend calendar chart and a dividend growth chart.
In the Android app, expand a holding’s dividends to see them newest first, with their total. Add dividend and a dividend’s Edit action open the same sheet: an amount, an ex-dividend date and an optional pay date, which Clear pay date removes. Saving and deleting need a connection. A dividend whose stored amount is zero or negative can still be edited as long as you leave the amount alone; a changed amount must be greater than zero.
Portfolio summary
Section titled “Portfolio summary”At the top of the page, a summary shows the following across all holdings, converted to your base currency:
- Total market value.
- Total cost, fees included.
- Unrealized gain (with its percentage of cost).
- Total foreign-exchange gain.
Allocation by currency
Section titled “Allocation by currency”Under the portfolio summary, the page has tabs: Holdings, Allocation by currency, Allocation by class, Invested over time, Value over time and Performance. Holdings is shown first and holds the list described above. The other tabs describe your whole portfolio and ignore the filters of the Holdings tab.
Allocation by currency shows your holdings by the currency each one is held in, converted to your base currency at today’s rate. A chart and a table give the same figures, and the rows of the table add up to the total shown at its foot.
A currency with no exchange rate is listed in the table with No rate. It is left out of the chart and of the total, and a notice above the chart names it, with a link to add the rate. This total can therefore be lower than the summary’s market value, which counts such a holding at a rate of 1.
Allocation by asset class
Section titled “Allocation by asset class”Allocation by class shows your holdings split by the asset class you gave each purchase (stock, ETF, bond, crypto, cash, real estate, commodity, other), in your base currency at today’s rate. A chart and a table give the same figures, and the rows of the table add up to the total shown at its foot.
A purchase with no class is counted in an Unclassified row, which is always shown last. If the purchases of one ticker have different classes, the ticker is split across their rows. The class is set in the holding form. You can open the tab directly by adding ?tab=class to the page address.
A purchase with no current price and a purchase in a currency with no exchange rate are left out of the chart and of the total, and a notice above the chart names the tickers and the currencies (with a link to add the rate). This total can therefore be lower than the summary’s market value, which counts a purchase without a price at its cost and a purchase without a rate at a rate of 1.
Invested over time
Section titled “Invested over time”Invested over time shows the amount you put in, per month or per year, counting only the lots you currently hold. Each lot counts its total cost, fee included, converted at the exchange rate of its purchase date, so the bars add up to the total cost in the portfolio summary. A month or year with no purchase shows zero.
Switch between Month and Year above the chart. A table for screen readers lists every period and its amount.
Value over time
Section titled “Value over time”Value over time shows how your portfolio performed over five periods, as five cards: Today (the change since the previous close), YTD (since 1 January), 1Y, 5Y and All time (since your first purchase). Each card gives the return as a percentage, the gain in your base currency and the date it counts from.
The gain is the value now, minus the value at the start of the period, minus what you bought during the period. The percentage is that gain divided by the value at the start plus what you bought during the period. A period that starts before your first purchase counts from that purchase, and the card shows that purchase date. Currency movements are part of the gain, because everything is in your base currency.
The values use closing prices from the price provider and your stored exchange rates, so they can differ slightly from the market value in the summary, which uses the last refreshed price. Dividends received in the period are on their own line and are not part of the return.
A card says No price history for this period when the value at the start cannot be computed, and never shows 0. When a period has a figure but no percentage, the card shows a dash and says there is no base to compare against.
A holding is left out of the figures, and named under the cards with its reason and a count, when its price is entered by hand, its currency has no exchange rate, the price provider did not answer or has no history for it, or the provider quotes it in a different currency than the holding. A holding with no price at the start of a period is left out of that period only, and that card names it. When the provider does not answer, use Retry and the figures come back. Annualised return is not computed.
Under the cards, a chart shows the value of your portfolio and the amount you invested over time. The solid, filled line is the value, and the dashed stepped line is the amount invested, which rises on each purchase date. Choose 1M, 6M, 1Y (the default), 5Y or All above the chart: 1M, 6M and 1Y show daily points, and 5Y and All show weekly points. Both lines are in your base currency. The value uses closing prices from the price provider and your stored exchange rates, and the invested amount counts the total cost, fee included, of the lots bought by each date. The chart starts at your first purchase, or at the first day the provider has prices when that is later.
Choose Table above the chart to read the same figures as a table of dates, values and invested amounts, and use the download button for a CSV file. A screen reader reads a summary of the chart: the number of points, the first and last date, and the latest value and invested amount. Holdings that cannot be valued are left out of the chart and named under it with their reason and a count. When the price provider does not answer, a message with Retry replaces the chart.
Prices are fetched live from the price provider, kept for a few minutes and never stored. You can open the tab directly by adding ?tab=value to the page address.
Performance
Section titled “Performance”Performance ranks your tickers by price gain: the current value of a ticker compared with its total cost, fee included, in the holding’s own currency. Exchange rates are left out, so a move of the currency alone does not show as a gain or a loss.
The tab lists the five best price gains and, next to them, up to five of the lowest, each with its rank among all the ranked tickers. Select a ticker to open its price history.
The tab opens on a treemap: each ranked ticker is a tile sized by its value in your base currency and coloured by its price gain, from the deepest loss to the highest gain, with the percentage written on the tiles large enough to hold it. Choose Table above it to list every ranked ticker with the same figures.
A ticker with no current price or no exchange rate is listed under Unpriced holdings, and one whose total cost is zero under Zero-cost holdings. Neither is ranked.
Price history
Section titled “Price history”Open a ticker’s price history with the chart button at the end of its row, or, for a ticker with a single purchase, from the actions menu of its row, or by selecting a ticker on the Performance tab. Choose 1M, 6M, 1Y (the default), 5Y or All; All shows weekly closing prices.
The line is the closing price. A diamond marks each of your purchases on its date, at its cost basis, and the dashed line is your average cost basis, fee excluded. Prices are in the currency of the holding and nothing is converted. Purchases made before the chosen period are not drawn, and a note under the chart says how many. The markers and the average cost line are hidden when the provider quotes the ticker in another currency than the holding.
The history is fetched live from the price provider and kept for a few minutes. It is never stored. A holding whose price you enter by hand has no history. When the provider has no prices for the period, try a longer one. When the provider does not answer, use Retry.
Exporting holdings
Section titled “Exporting holdings”Export your full holdings list as CSV, ODS, or XLSX from the Export menu on the Investments page. The Purchase cost column includes the fee, and the fee itself is the last column.
Grouping in the Android app
Section titled “Grouping in the Android app”A Flat / By ticker / By account switch at the top of the Android app’s Investments list lets you choose how holdings are listed:
- Flat lists every purchase lot.
- By ticker shows one row per ticker (tap to see its lots).
- By account shows one row per ticker within each account.
The app remembers your choice.