Dashboard
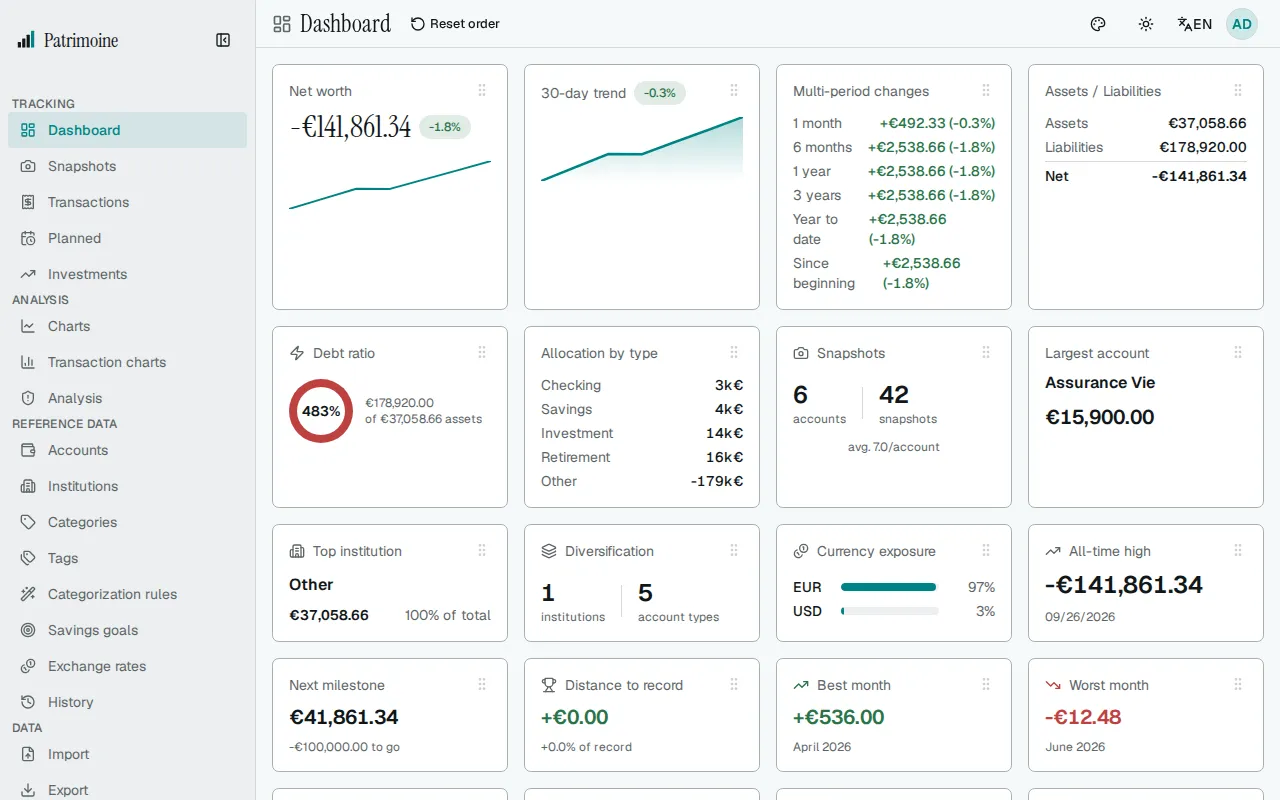
The Dashboard is the app’s home page (also reachable from the sidebar) — a customizable grid of cards summarizing your finances at a glance.
Setup checklist
Section titled “Setup checklist”Until you have an account and a first snapshot, a Get set up card sits at the top of the Dashboard, under any exchange-rate notice. It lists three steps that tick themselves from your data as you go: add an account, record a first snapshot, and set the base currency. The base currency step counts as done as soon as you have an account; its line shows the currency your totals and charts use, and Open settings leads to where you can change it. Each step that is not done has a button leading to the right page, and the next step to do has the highlighted one. The card disappears on its own once your account and first snapshot exist.
The card also has an Already have data? block with Import a file and Restore a backup, both leading to the Import page, to bring in a bank file or restore a backup instead of starting from scratch.
Choose Hide checklist to hide the card on every device you sign in on. A message confirms it and offers Undo for a few seconds; after that, the card cannot be brought back from Settings.
Snapshot reminders
Section titled “Snapshot reminders”A banner warns you when your last snapshot is 7 days old or more, with a button to record a new one. A line under the cards says when the last snapshot was recorded. With no data at all, the Dashboard offers a New snapshot button.
Every card lives in the card library, grouped by what it shows:
- Overview: net worth, the 30-day trend, changes over several periods, assets and liabilities, debt ratio, the breakdown by account type, quick actions, liquidity, runway, allocation, the net worth range and the change in net worth since last month.
- Money this month: spendable this month, overdue bills, monthly budgets, envelopes, this month’s cash flow, the savings rate and a spending heatmap.
- Accounts: snapshot counts, largest account, top institution, diversification, currency exposure and data freshness.
- Growth and records: all-time high, next milestone, distance to the record, best and worst month, snapshot cadence, growth rate and the update streak.
- Goals and plans: next goal, total saved, goals reached, the next recurring snapshot, the next 14 days of planned transactions and the path to financial independence.
- Investments: best and worst holdings, the split by currency and dividends by month.
- Debts: the balance left on each loan and when it is paid off.
A dashboard you have never arranged, such as the first one on a new account, starts with 17 of these cards, in this order: Net worth, Investments performance, Spendable this month, Quick actions, Data freshness, Allocation, Financial independence, Growth, Multi-period changes, Liquidity, Upcoming calendar, Next goal, Snapshots, Largest account, Distance to record, All-time high and Diversification. The other 23 cards are one click away in the card library, and a card whose data does not exist yet is not drawn until it does.
Visual cards
Section titled “Visual cards”Fourteen cards show your data as small charts or ranked lists. Six of them are among the default cards; Monthly budgets, Envelopes, Month cash flow, Debts, Net worth range, Spending heatmap, Dividends by month and Net worth change are added from the Card library. A card whose data does not exist yet stays hidden, so you never see an empty chart; in the library such a card says it is shown once your data allows it. When a card is made as narrow as it can be, it shows a one-sentence summary instead of its chart, and every chart has that same sentence for screen readers. Colour is never the only signal, and amounts follow Privacy mode.
- Runway shows how many months of spending your liquid assets would cover, counting only the immediately available funds against your average monthly spending over the last three complete months. The figure is green at 6 months or more, amber from 3 to under 6 and red under 3, and the band is also said in words. It is a library card, not part of the default set, and appears once both your liquid assets and your spending are known.
- Savings rate shows the share of your income you kept in the last complete month, as a large figure, with the average of the last 12 complete months below it. It uses the same transfer-aware rate as the savings rate chart, leaves out categories excluded from spending, and a month without income counts for nothing. A rate under zero is red: you spent more than you earned. It is a library card, not part of the default set, and appears once a complete month has income.
- Liquidity shows how much of your assets is available now, soon or only later, from the liquidity level of each account, as a donut with the immediate share in the middle and a legend of the availability levels.
- Allocation shows your assets by account type as a donut (the four largest types and the rest as Other) with the total in the middle in a compact form and, when you hold several currencies, the split by currency as a bar under it. Liabilities are not included.
- Net worth range shows where today’s net worth stands between its lowest and highest point of the last 12 months. It appears once the period holds two points and the two differ.
- Data freshness gives a one-line verdict (“All 9 accounts are up to date” or “3 of 9 need a snapshot”) and one colored pill per account, the stalest first. The color is the level: up to date is 7 days or less, getting old is 8 to 30 days, out of date is over 30 days; an account with no snapshot yet gets a dashed outline. With up to nine accounts each pill shows its age in days, with more it shrinks to a small block. Point at a pill, or move to it with the keyboard, to see the account name, its level in words, its age and the date of its latest snapshot. Archived accounts and accounts in the trash are left out.
- Monthly budgets shows the four budgets closest to or past their limit this month, with a marker at the share of the month that has passed. What is spent and the limit follow the Budget page, including a month’s own limit and rollover.
- Envelopes shows a ring for each of the four envelopes due soonest, how much is set aside, and the amount to put away each payday. Archived envelopes are left out.
- Month cash flow shows this month so far: your income, your three largest spending categories, other spending, and what is left over or the shortfall.
- Spending heatmap is a calendar of this month’s daily spending. It follows the same rule as the spending charts: categories excluded from spending, transfers and accounts outside the budget are left out, amounts are in your base currency at each day’s rate, and a day with only expenses in a currency that has no rate counts as no spending.
- Upcoming calendar shows the next 14 days of planned transactions, with the next three listed and an overdue count above. Skipped occurrences are left out. Days on which a pay schedule pays are underlined in the strip and named in the card’s text description.
- Financial independence shows how far your investable balance is from the target set on the Financial independence report, a projection and the estimated date. It is hidden when the report cannot be computed.
- Debts shows a ring of each loan’s share of all your debt with the total in the middle, the three largest loans with their balance, and the payoff date computed from the rate and monthly payment set on the account. Other loans count as one more part of the ring. With a single loan it lists the loan and its payoff date, without a ring.
- Investments performance shows your three best and three worst holdings by price gain as bars, and, when you hold several currencies, a ring of your investments by currency.
- Dividends by month shows the dividends received in each of the last 12 months as a column chart, in your base currency: a month without a dividend is an empty slot, the best month is highlighted and the average is a dashed line. The total, the best month and the average are also written out.
- Net worth change shows what moved your net worth since the end of last month: contributions (transfers into savings, investment and other accounts outside the budget), market (the rest of the change of those accounts), debts (paying a debt down counts as a gain), and everyday accounts (spending and income on accounts in the budget). Accounts whose transfers could not be converted for lack of an exchange rate are shown as not split.
Charts on the standard cards
Section titled “Charts on the standard cards”Most of the standard cards now draw a small chart beside the figures they always showed. Every figure is still there. A card made as narrow as it can be shows one sentence instead of its chart, and every chart has that sentence for screen readers. Colour is never the only signal, and Privacy mode hides amounts but not percentages, ratios or the shape of a chart.
- Donuts: Currency exposure shows your currencies as a donut with the largest share in the middle and a legend of every currency.
- Ranked bars and splits: Allocation by type ranks your account types as bars, and shows a negative one in the negative colour. Assets / Liabilities adds a bar that splits assets plus liabilities into two parts, only when you owe something. Spendable this month splits the available balance into expenses still to come, budget reserves and what is spendable; its bar appears only when those parts add up to the figure and, when you are over-committed, shows the two committed parts across the whole bar.
- Share and progress bars: Top institution and Largest account show their share of your assets. Distance to record shows net worth against its record, with the end of the bar as the record. Next milestone shows net worth against its target, and draws no bar in Privacy mode because the bar would reveal your net worth. Next goal marks on its bar how much of the time between its start date and its deadline has passed. Total saved shows what you saved against the combined target of your goals.
- Rings: Debt ratio is a ring with marks at 33 and 50 percent: green under 33 percent, amber from 33 to under 50 percent and red from 50 percent, and the band is also said in words (low, moderate or high). Goals completion is a ring of the goals you completed.
- Columns and dots: Best month and Worst month show the last 12 months of net worth change as columns above and below a zero line, with the average dashed and their own month highlighted. Recording velocity shows the days with a snapshot in each of the last six months, this month highlighted and the average dashed. Current streak shows the last 12 weeks as dots, filled where you recorded a snapshot that week, with the current week ringed.
- Lines: the 30-day trend marks its latest point. Growth draws your whole history over the dashed line of the steady growth that its annual rate implies.
- Lists: Overdue bills shows how many days late each of the first three bills is, the most overdue first, on a bar that is full at 30 days.
Net worth keeps the chart it already had, and six cards stay as figures because a chart would add nothing: changes over several periods, quick actions, snapshots, diversification, all-time high and the next recurring snapshot.
Net worth
Section titled “Net worth”The Net worth card shows your current net worth and how much it changed over a period you choose with the selector inside the card: 1M (one month), 3M (three months), YTD (since 1 January of the year of your latest figure), 1Y (one year, the default) and All (your whole history). The change is a signed amount with an arrow and, unless the period starts at zero, a percentage. A period that reaches back further than your history uses all of it.
When the card is wide enough, as it is at its default size, it also draws the period as an area chart. The last point is emphasised, the lowest and highest values are marked and written under the chart, together with the first and last date of the period. A narrower card shows only the figure and the change, and a period with fewer than three points shows no chart.
The selector works from the keyboard: Tab reaches it once, then the arrow keys, Home and End change the period. Screen readers read a sentence with the period, the start and end values and the change. Privacy mode hides the amounts, not the percentage.
The period you choose is remembered in this browser only. It is not saved to your account, so another browser or device starts on 1Y.
Spendable this month
Section titled “Spendable this month”The Spendable this month card shows how much of your money you can still spend until the end of the month. The figure is the balance of your immediately available accounts, minus the planned expenses still to come until the end of the month, minus what your category budgets still reserve. Accounts marked as off budget are left out of this figure, while they still count in balances and net worth. Accounts excluded from net worth are left out of it too. Moving money between two of your spendable accounts does not change this figure, while moving it to an account outside this pool does.
Each category reserves the larger of what is left of its budget this month (the month’s own limit when it has one) and its planned expenses still to come, so a planned expense in a budgeted category is not counted twice. A budget on a whole category covers its subcategories, so their own budgets are not added on top. With rollover on, the unused amount carried from earlier months counts. Budgets count spending from all your accounts.
Planned expenses outside any budget, or without a category, are subtracted in full. Overdue planned transactions count as due today, and failed ones are left out. Planned income is not added to the figure. Expenses already recorded on a counted account with a date later this month (a deferred card payment, for example) are subtracted in full too, because they have not left the account yet, while their category budget counts them as spent. Income recorded with a later date this month is shown with the expected income and is not added either.
The figure can be negative when planned expenses and budgets exceed the balance. It is then shown with its minus sign, together with a sentence saying so.
An account without a snapshot or without an exchange rate is left out, together with its planned transactions. When no account is counted, the card says why: an exchange rate is missing (it names the currencies), an account has no snapshot yet (with a button to record one), or no account can be counted at the selected liquidity levels. View breakdown stays available, so you can choose other levels.
Choose View breakdown to see how the figure adds up: the available balance, the expenses still to come (planned expenses beyond what budgets already cover, plus expenses recorded with a later date), the budget reserves, and the total. Expected income this month is shown apart and is not included in the figure.
Notices appear when the oldest snapshot is more than 35 days old, when an exchange rate is missing, when an account has no snapshot yet and when a planned transaction failed.
The Accounts menu in the breakdown chooses which liquidity levels are counted. Immediately available accounts are counted by default and at least one level always stays selected. The choice is not remembered and does not change the Forecast tab.
Several dashboards
Section titled “Several dashboards”Your dashboards are tabs along the top of the page, and the first one opens each time you visit. The Manage dashboards button next to the tabs opens a dialog where Add dashboard creates a new one from a name of up to 40 characters. You can have up to 8 dashboards. A new dashboard starts empty: use Customize to put cards on it.
In the dialog, choose the pencil button of a dashboard to rename it: Enter saves and Escape cancels. Change the order by dragging a row by its handle or with the up and down arrows, and the tabs follow. The bin button deletes a dashboard after a confirmation that says how many cards move to the first remaining dashboard. The last dashboard cannot be deleted.
Customizing the layout
Section titled “Customizing the layout”Choose Customize to edit the layout. Drag a card by the handle in its top-right corner to move it, and drag its bottom-right corner to resize it. The other cards move out of the way and gaps close, and a card cannot be made smaller than its minimum size. Your changes stay a draft until you choose Done, which saves them. Revert changes discards the draft after you confirm, and leaving the page without choosing Done discards it too. Choose Done when you are finished.
In Customize mode every card also has an options button (three dots) next to its handle. Hide card removes the card from the dashboard, and the card library brings it back. A dashboard with no cards shows a message with a Customize button.
The options button also moves a card one step up, down, left or right, and makes it one column wider or narrower, or one row taller or shorter, so the whole layout can be arranged with the keyboard or a screen reader. A choice is greyed out when the card is at its minimum size or at the edge; each change is announced.
When you have more than one dashboard, the options button also has Move to dashboard, which lists your other dashboards. Choose one and the card leaves this dashboard and goes to the bottom of the chosen one at its default size. A card is on one dashboard at a time. When you delete a dashboard, its cards move to the first remaining dashboard.
Reset layout, after a confirmation, puts the default cards of this dashboard back in their default order and size, and adds the default cards that are on no dashboard and not hidden. Any other card, including one you added from the library, leaves the dashboard and is available in the library again; none is deleted. Hidden cards stay hidden, and a card that is on another dashboard stays there.
Tidy up layout, in the Customize toolbar, looks for a more compact arrangement of the cards on this dashboard. It packs the cards at the height they are really drawn, which is at least what their content needs. By default it also shortens a card that is taller than its content, so the cards below can move up; untick Trim cards to their content in the preview to keep every card’s size and only move them. A width never changes. The dashboard gets shorter and has fewer empty cells, and the preview says how many cards are made shorter. Nothing changes until you agree: a preview shows today’s layout and the proposed one side by side as numbered blocks. The numbers follow today’s reading order (top to bottom, then left to right) and the cards that change place are highlighted. Each diagram is captioned with its height in rows and its number of empty cells, and a sentence above says how many rows are saved and how many cards change place, so the preview can be read without the diagrams. Apply puts the arrangement on the dashboard, to be saved by Done, and Cancel leaves everything as it is. After you apply it, a message offers Undo for a few seconds: it puts the previous layout back in one step, and does nothing if the layout has changed since. When no shorter arrangement is found, the preview says the layout is already compact, shows only today’s layout and offers only Close. Hidden cards and other dashboards are left alone, cards waiting for data are arranged with the others because they sit on the grid while you customize, and the cards that move keep the order you arranged wherever that costs no rows.
Tidy up layout is a search for a good arrangement, not a proof of the best one. The result is never taller than your current layout, but it is not guaranteed to be the shortest possible. Rows are counted from the sizes saved in your layout, so a card that needs more room than its saved height still grows on screen, as it does today.
On a phone the cards are shown one under the other, in the order of your layout, and have no handles. In Customize mode, the options button of a card moves it up or down one place, moves it to another dashboard, or hides it. Moving and resizing by dragging is available from tablet width up. Tidy up layout works on the grid too, so it is available from tablet width up and is not offered on a phone.
Your layout is saved with your account, so it is the same on every device you sign in on. If saving fails, the Dashboard says so and offers to try again; nothing is lost.
Card library
Section titled “Card library”In Customize mode, Card library in the toolbar opens a gallery of every card. On a phone it fills the screen.
Each card is shown as a small picture of the real card, drawn from example data and never from your own figures, grouped under headings by theme. A tile gives the card’s name, a one-line description, its default size in columns by rows, and where it stands: Available, On this dashboard, or on another dashboard, which it names. A card that is available but has no data yet says it is shown once your data allows it.
Type in the search box to find a card by name or description (capitals and accents do not matter), and choose All cards or Not on this dashboard to narrow the list. The number of cards shown is announced to screen readers.
Choose Add to put an available card at the bottom of the dashboard you are editing, at its default size. A card also needs data to be drawn. One with no data yet, such as Debt ratio before you have a liability account, Overdue bills while no planned transaction is overdue or Current streak without a snapshot from this week or last week, can still be added: its tile says what it waits for and the announcement repeats it. While you customize, a card that waits for data stays on the grid as a placeholder that says what it waits for, so you can move it, resize it or hide it like any other card, and a line under the toolbar lists them; placeholders are not drawn once you choose Done, and each card appears on the dashboard as soon as its data exists. A card that is on another dashboard offers Move here: after a confirmation that names the dashboard it comes from, it leaves that dashboard and goes to the bottom of this one, because a card is on one dashboard at a time. A card already on this dashboard is marked On this dashboard. The library stays open, so you can add several cards in a row, and each change is announced. To take a card off a dashboard, use Hide card in its options menu; it then shows as available again.
With the keyboard, Tab moves through the search box, the filter and the tiles, and Escape closes the library and puts focus back on the Card library button.
A card added in a later version of Patrimoine appears in the library only: it is never added to a layout you already have. A dashboard you have never arranged shows the 17 default cards listed under Cards, while a dashboard you have already arranged keeps its layout, and the default cards it does not hold, such as Liquidity or Diversification, are available in the library.