Charts & Analytics
The Charts page turns your snapshot history into visual insight, and the Analysis page adds risk and liquidity analysis on top.
Two further reports are on the Reports page rather than here: the date from which your investments could cover your spending, and a cash flow diagram of where your income goes.
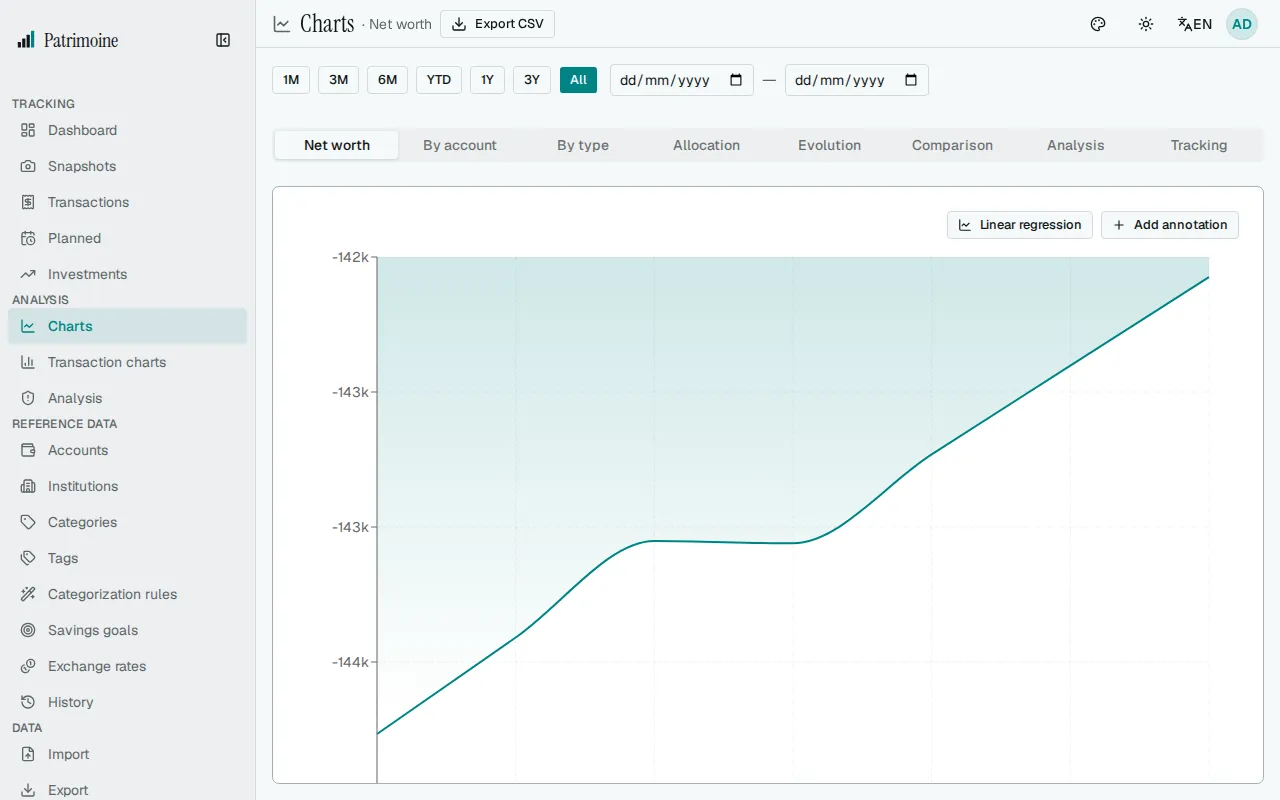
Chart tabs
Section titled “Chart tabs”The selected tab is kept in the address as ?tab=, for example ?tab=tracking, so you can bookmark a tab or share a link to it. An unknown value opens the first tab.
Every tab except Forecast has a period selector: presets 1M, 3M, 6M, YTD, 1Y, 3Y and All, or a custom start and end date. The period you pick is kept while you move between the Charts and Transaction charts pages, until you reload the app.
The Charts page has one tab per view:
- Net worth evolution over time. An account with no balance on a given date keeps its last known balance, so the curve does not dip when you update accounts on different days.
- Per-account trend lines.
- A stacked breakdown by account type.
- An allocation view (type, institution, assets vs. liabilities, currency exposure, holdings treemap).
- Evolution metrics (monthly/yearly change, drawdown, year-over-year comparison, inflation-adjusted value).
- A per-account comparison bar chart.
- A deeper analysis view (waterfall, drawdown).
- A tracking view (consistency score, snapshot heatmap, delta heatmap, savings goals).
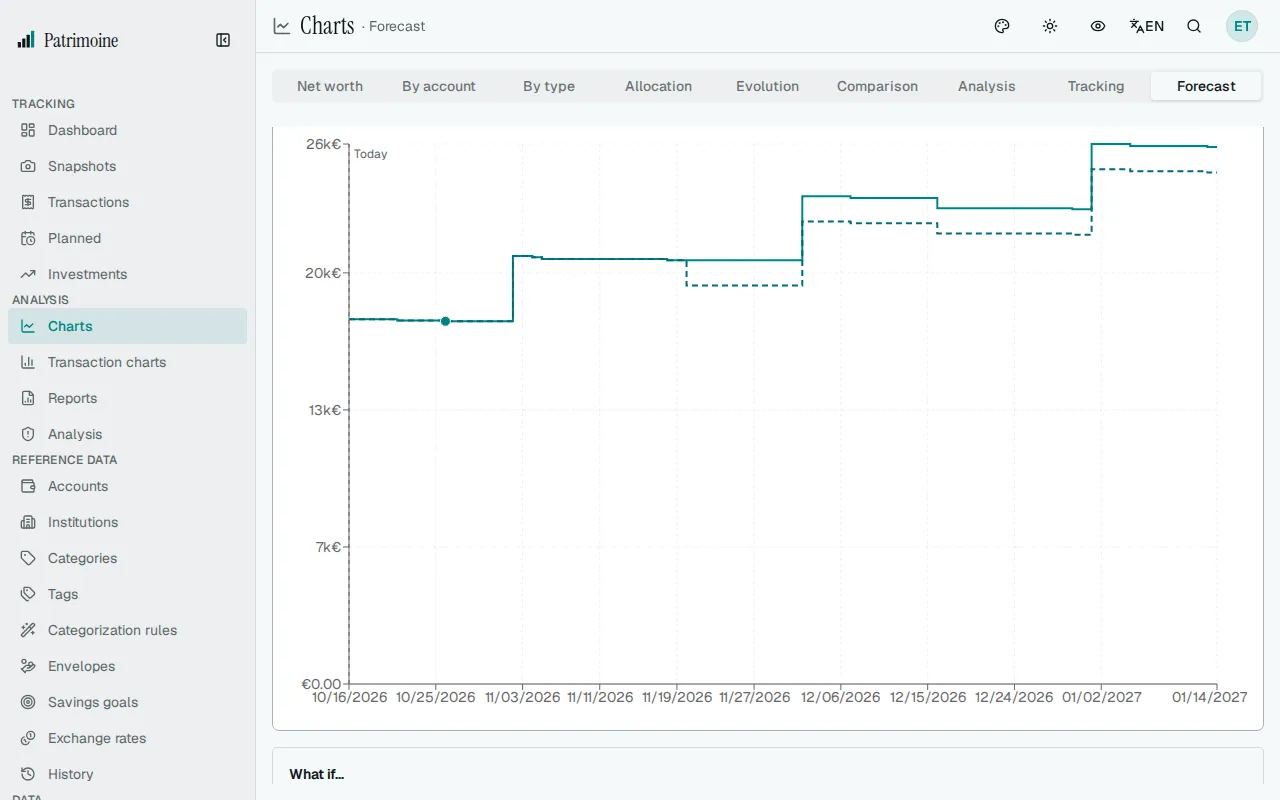
- A balance forecast, showing how the balance of your immediately available accounts is expected to move day by day with your planned transactions.
The Net worth and Allocation by type charts show a one-line summary under their title: the latest net worth, its date and the change since the start of the period, and the largest account type with its share of the total. Every chart also has a text description that screen readers read out after its title. With privacy mode on, the amounts in both are hidden.
Accounts you excluded from net worth are left out of the net worth, stacked and waterfall charts, the allocation charts, the delta heatmap, the Risk & liquidity analysis and the balance forecast of your available accounts. The per-account trend lines, the comparison chart and a forecast you run for that single account still show them.
The waterfall also tells you how much of the change came from exchange rates. For an account held in a foreign currency, the tooltip shows an Of which exchange rate line, and a sentence under the chart gives the total. It is the closing balance times the move of the rate between the two dates, so a deposit made halfway through is valued with the whole move. An account with no rate on one of the two dates is left out of that figure, and a note says how many.
Chart annotations
Section titled “Chart annotations”On the net worth chart, add a dated, labeled marker (for example “Bought a car”) to pin context onto a specific point in your history. Each marker is drawn on the chart with its label, and the hover tooltip lists it for its date. The Annotations (n) button above the chart opens the full list, where you can edit an annotation’s date or label, or delete it after a confirmation.
The delta heatmap
Section titled “The delta heatmap”In the tracking tab, the delta heatmap shows how your net worth typically changes by day of the week and by day of the month, helping spot recurring patterns.
The balance forecast
Section titled “The balance forecast”The Forecast tab projects the balance of your immediately available accounts for the coming days from your planned transactions. It starts from today’s balance, which is the latest snapshot of each account plus the transactions recorded after it, up to today. An account with no snapshot is left out, together with its planned transactions.
The horizon selector looks 30, 90 (default), 180 or 365 days ahead. The account selector follows a single account in its own currency, and planned transactions without an account then do not count.
Planned transactions fall on the same dates automatic posting uses, including month ends and 29 February. Disabled, deleted and already posted ones are not shown, and failed ones are left out. An overdue planned transaction is counted once, today, so if you already paid it, mark it as paid. One that already passed its end date, or its number of occurrences, is not shown, although automatic posting would still record it one last time.
Skipped dates still appear in the day’s details, greyed and struck through with “(skipped)”, so you can see what you left out; they do not change the projected balance. A date moved by the weekend option appears on the day it will post.
Amounts are converted to your base currency with the latest exchange rate on or before today, and planned transactions without an account are included as long as at least one account is counted in the total (with no counted account, nothing is projected). An account in a currency with no exchange rate is left out of the total, and archived accounts are never included.
The line moves in steps on planned dates. A dashed line marks today, a dot marks the lowest balance, and the area below zero is shaded when the balance is expected to go negative. The chart’s CSV button downloads the daily balances.
Notices above the chart tell you when the forecast rests on partial data. A warning appears when the oldest of your accounts’ latest snapshots is more than 35 days old; record a new snapshot to refresh the starting point. Another names the currencies whose accounts are left out for lack of an exchange rate, another gives the number of accounts left out because they have no snapshot yet, together with their planned transactions, and another gives the number of failed planned transactions that are not counted. If nothing is planned, the tab says so and links to the planned transactions page; if no account in the forecast has a snapshot yet, it asks you to record one.
Trying a what-if
Section titled “Trying a what-if”Below the forecast, the What if… block adds hypothetical expenses or incomes to see how the forecast would change, without saving anything. Select Add another for more than one, up to five. Enter a label, an amount, whether it is an expense or an income, its first date and whether it happens once, every week or every month, then select Simulate. A dashed line appears on the chart next to the real forecast, and the block states the change in the lowest balance and in the balance at the end of the horizon. Clear removes it. For a weekly or monthly item, a field under the frequency sets the step: every 2 weeks (up to 52) or every 2 to 11 months.
- The simulation uses the horizon and the account selected above it, and is dropped when you change either.
- Nothing is created: the item is not added to your planned transactions and is gone when you leave the page.
- In a single-account view the item counts on that account; in the pooled view it counts as an account-less item.
The savings rate
Section titled “The savings rate”The savings rate tab on the Transaction charts page shows, for each month, the share of your income that you saved. The server calculates it as income minus expenses plus the net amount you moved to off-budget accounts, divided by income.
- Transfers between your own accounts are not income or expenses.
- Money moved from an on-budget account to an off-budget account, including a loan account, counts as saved. Money moved back is subtracted.
- A month without income shows no point on the chart.
- The tooltip lists the amount moved to off-budget accounts for the month, when there is one. The CSV export gives the same figures, with a
transferredcolumn.
Exporting a chart as CSV
Section titled “Exporting a chart as CSV”Most chart tabs and cards offer a CSV download of the exact data shown, so you can analyze it further in a spreadsheet. A text cell that starts with =, +, - or @ (a category or account name, say) is written with a leading apostrophe so a spreadsheet shows it as text instead of running it as a formula; numbers are not changed. Report exports follow the same rule.
Risk & liquidity analysis
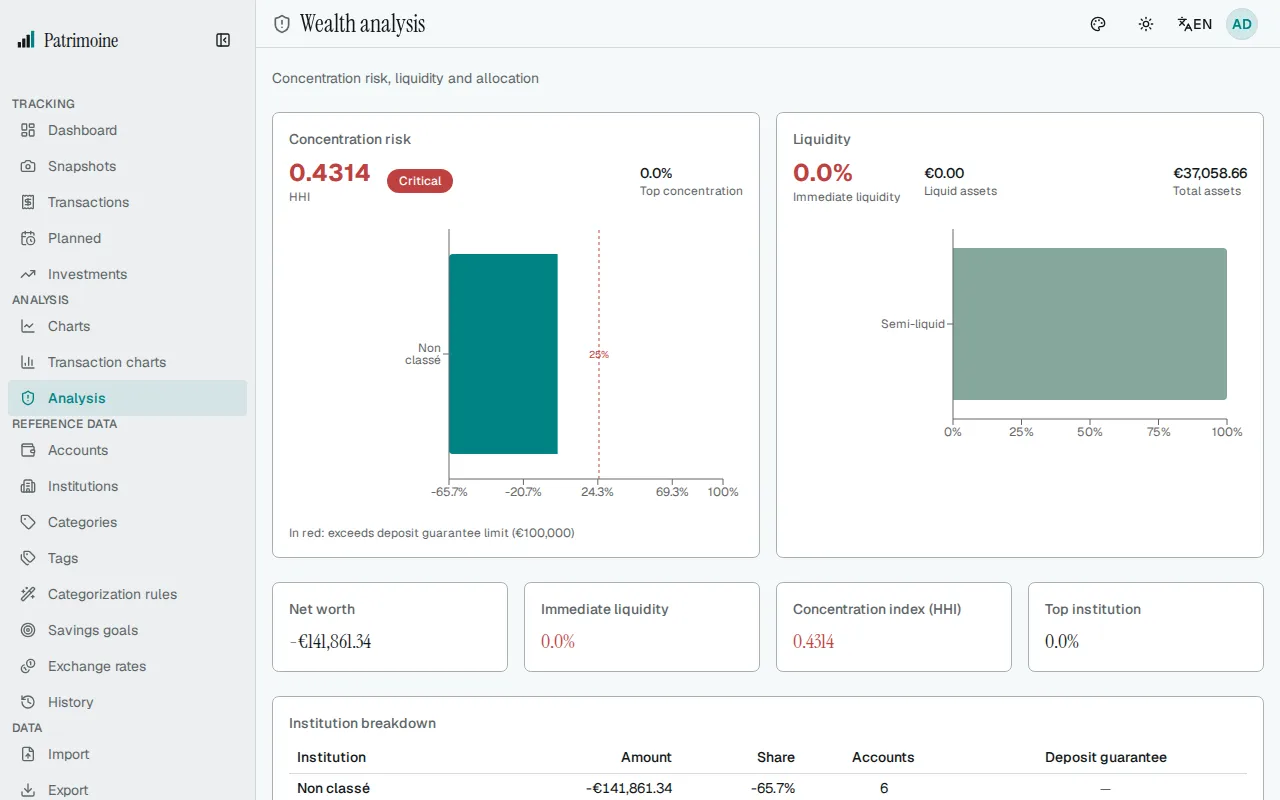
Section titled “Risk & liquidity analysis”The Analysis page shows two analyses:
- A concentration analysis: an HHI index and a per-institution balance breakdown, flagging in red any institution holding more than the EUR 100,000 deposit-guarantee limit, with a risk level from Low to Critical (only checking and savings accounts count toward the threshold).
- A liquidity breakdown by how quickly funds are accessible (immediate, semi-liquid, blocked, long-term). It also shows how many months your immediately available funds would cover, based on your average monthly spending over the last three complete months (transfers and off-budget categories left out).
The printable summary report
Section titled “The printable summary report”The Summary page is a print-friendly report with your current net worth, a trend indicator, and a per-account balance table. Use Print for the browser’s print dialog, or Download PDF to generate a client-side PDF containing:
- The net worth total and trend.
- A vector-drawn evolution chart.
- Key metrics: CAGR, average, minimum/maximum, best/worst month, volatility, and the consistency score.
- The per-account balance breakdown.